
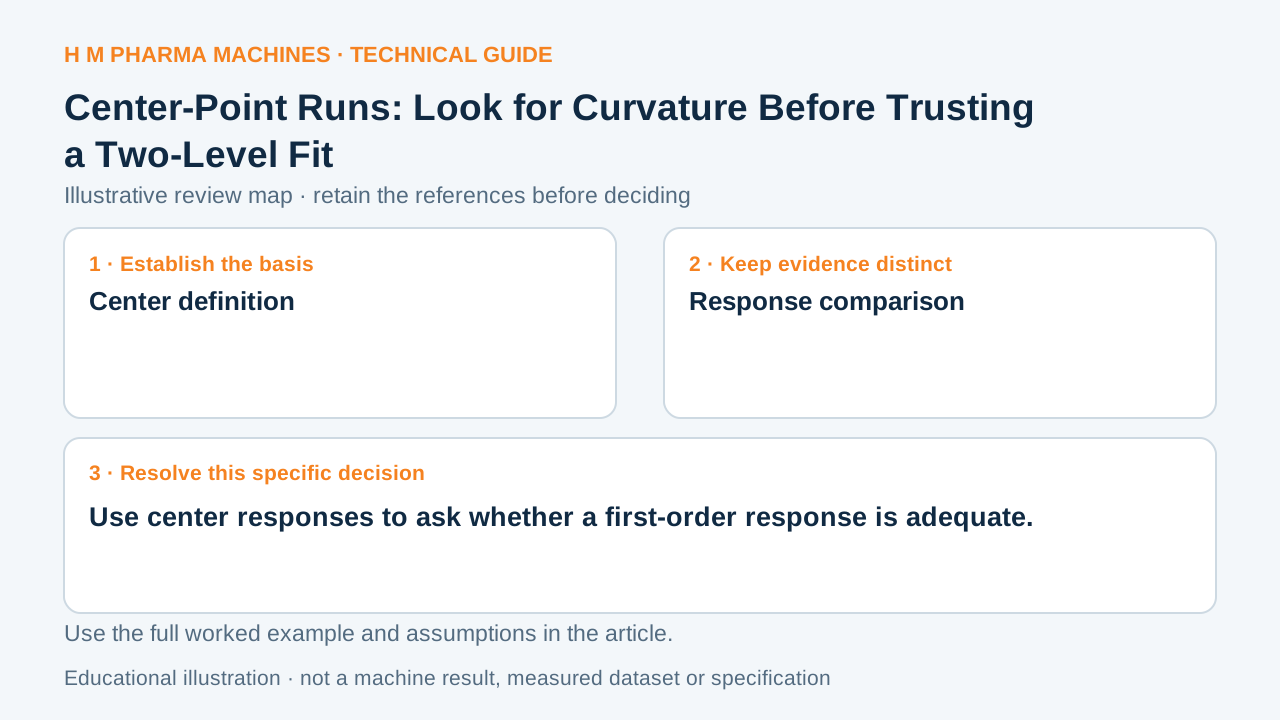
Center responses can reveal a curvature question that a two-level fit misses. The comparison must still account for variability and changes during the experiment.
The statistical question
Center-point runs in a factorial study can help assess process stability and possible curvature. A center response compared with the average factorial response provides a curvature check under the appropriate design and model. Detection is different from identifying each squared-factor contribution. Nominal factor categories do not automatically have a physical midpoint, and experimental variability still affects the interpretation.
An illustrative review example
Suppose the average of fictional factorial-corner responses is 10 units, while repeated center responses are 13,12 and 14 units, with average 13. The three-unit difference raises a curvature question. It is not yet a significance finding, and an uncontrolled change over run time could complicate the interpretation. These invented values do not establish a preferred setting or show which particular factor has a curved effect.
Prepare the evidence for discussion
Retain the physical center definition, response units, corner average, individual center readings and run timing. Ask the analyst how the design separates possible curvature from drift and what replication supports the comparison. If further modeling is needed, identify the additional authorized factor levels and physical conditions before collecting them. Do not convert an aggregate curvature indication into a claim that every second-order coefficient has been estimated.
A curvature check is not a full quadratic fit
This blank worksheet is for your own project. It contains no H M machine trial result.
| Question to resolve | Evidence to retain |
|---|---|
| Center definition | Physical midpoint or stated category |
| Response comparison | Center versus factorial average |
| Variability | Replicate evidence |
| Timing | Stability and drift observations |
Customer Questions
What can a center comparison reveal?
It can provide evidence about possible curvature under the relevant experimental design.
Does it identify each individual squared-factor effect?
An aggregate center comparison does not automatically estimate separate quadratic contributions.
Why keep run timing?
Changes during the experiment can affect the interpretation of center-versus-corner responses.
Primary References
These references support the technical principles discussed in this guide. The worked examples and review questions are educational.
Discuss Your Machine Requirement
Share your product, container, required output and the evidence needed for your technical review.
Request a Technical Review