
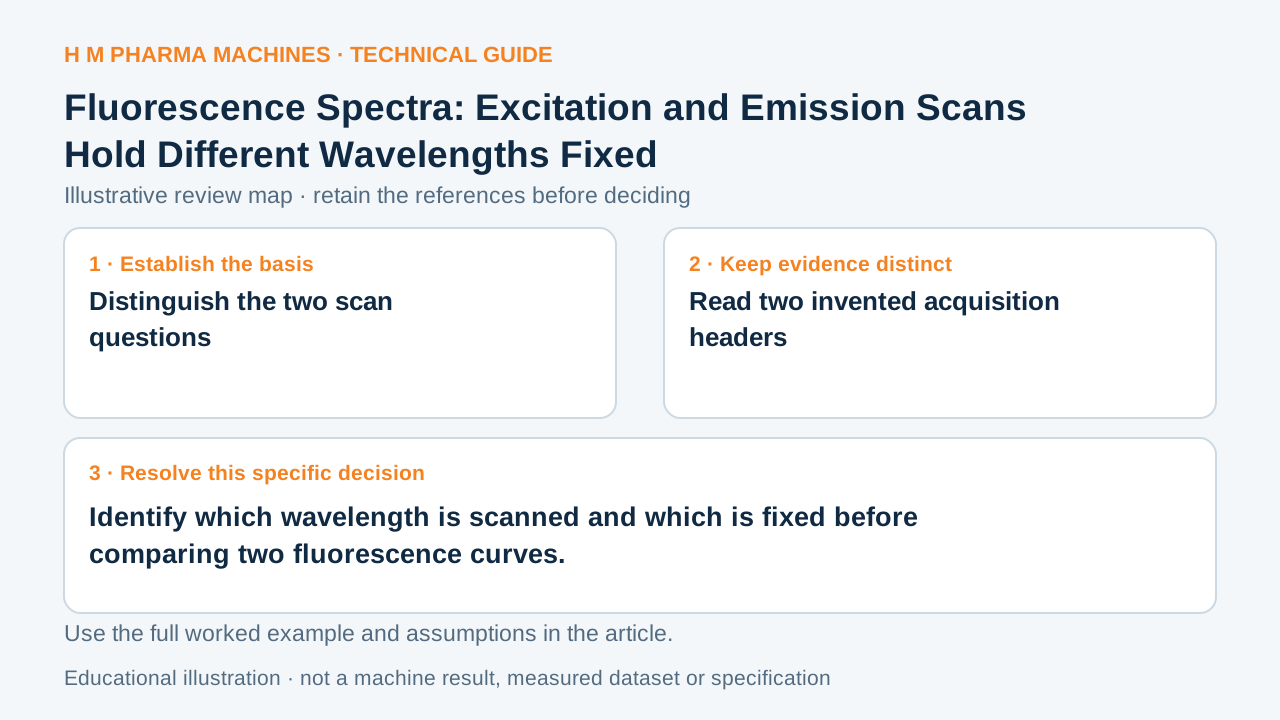
An excitation spectrum and an emission spectrum vary different coordinates, so their axes cannot be exchanged casually.
Distinguish the two scan questions
An excitation spectrum plots an observed response against excitation wavelength. An emission spectrum describes emitted spectral power against the emission coordinate. In the fluorescence scans considered here, one selected observation or excitation condition is held fixed while the other coordinate is scanned. Primary reference: IUPAC: excitation spectrum.
The records should also identify applicable response corrections. Excitation-power variation and wavelength-dependent detection response can affect the plotted result. A pair of spectra bearing the same axis unit can still answer different questions about how the measurement was acquired. Primary reference: IUPAC emission spectrum.
Read two invented acquisition headers
Worksheet E holds observation at 520 nm and scans excitation from 420 to 480 nm. Worksheet M holds excitation at 450 nm and scans emission from 480 to 600 nm. A point labeled 460 nm in E is an excitation setting; 560 nm in M is an emission observation.
A larger value at one point cannot be compared directly with another point from the other scan merely because both rows say intensity. The arbitrary headers are original examples. No fluorophore peak position, fluorescence efficiency or suitable wavelength pair is claimed.
Create a scan-identity worksheet
Include scan type, varied wavelength, fixed wavelength, wavelength interval, response unit and correction status. Copy those fields from the acquisition record before assigning a label such as excitation maximum or emission maximum. Keep a spectrum file linked to its header.
If the fixed condition or correction basis is unavailable, state that limitation instead of reconstructing it from the plotted curve. Review the selected bands and method evidence for the real sample separately. The practical decision here is to preserve scan identity, not to choose an analytical method or demonstrate a sample concentration.
Customer Questions
What is varied in worksheet E?
Its excitation wavelength is scanned.
What remains fixed in worksheet M?
Its excitation is set to 450 nm.
Do matching axis units establish equivalent scans?
The varied and fixed conditions must match.
Primary References
These references support the technical principles discussed in this guide. The worked examples and review questions are educational.
Discuss Your Machine Requirement
Share your product, container, required output and the evidence needed for your technical review.
Request a Technical Review