
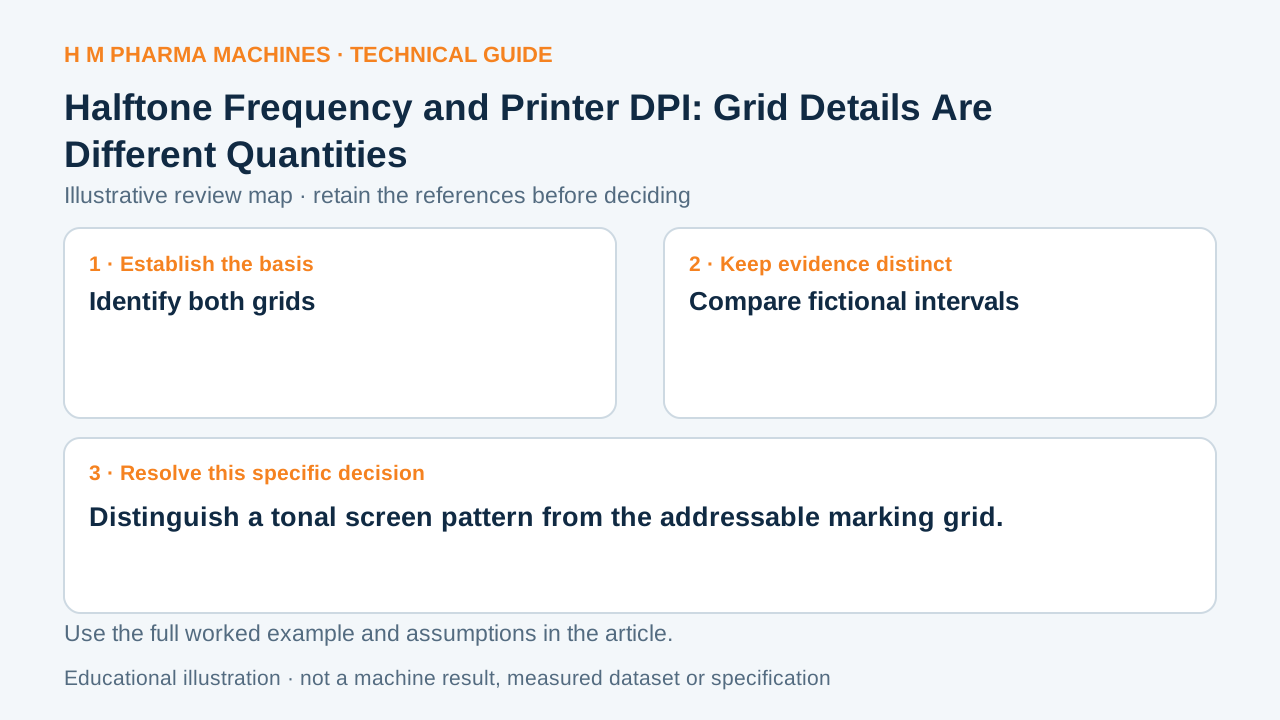
A tonal screen cell and a device dot are different units. A specification containing both needs to identify what each number describes.
Identify both grids
Printer resolution is expressed in dots per inch, while a halftone screen frequency is expressed in lines or cells per inch. The screen organizes tonal reproduction; the output device provides the addressable marking grid used to render it. Primary reference: Adobe: printer resolution and screen frequency.
An image's pixels per inch is a third quantity. Do not collapse all three into a single resolution field. Some printing processes use different screening approaches, so the actual output method must be identified before a simple cell-based comparison is used.
Compare fictional intervals
Imagine an illustrative 150-cell-per-inch screen and a 600-dot-per-inch device along one stated direction. Their nominal intervals are 25.4/150 = 0.1693 mm and 25.4/600 = 0.0423 mm. The linear ratio is four device spacings per screen interval in this simplified description.
That ratio alone does not predict tone levels, screen angles, print sharpness or achievable colour. The example omits actual screening and rasterization behaviour. It provides no preferred screen frequency and is not a production setting for any coder or printer.
Retain the output method with the proof
Ask the receiver which screening or marking process will be used and which values in the handoff describe that process. Keep the source image sampling and any resampling separate. Compare the actual output at the relevant photograph, gradient or fine-feature locations.
If the screening method changes, assess the resulting tonal and detail evidence instead of comparing only headline DPI. Preserve the released data and agreed output condition so a reviewer can trace whether a difference came from the source image, the screen organization or the device's physical marking result.
Customer Questions
Is screen frequency the same as device DPI?
No. They describe the tonal organization and marking grid respectively.
Does the four-to-one example predict print quality?
No. It is a simplified interval comparison.
What identifies whether the model applies?
Retain the actual screening and printing method.
Primary References
These references support the technical principles discussed in this guide. The worked examples and review questions are educational.
Discuss Your Machine Requirement
Share your product, container, required output and the evidence needed for your technical review.
Request a Technical Review