
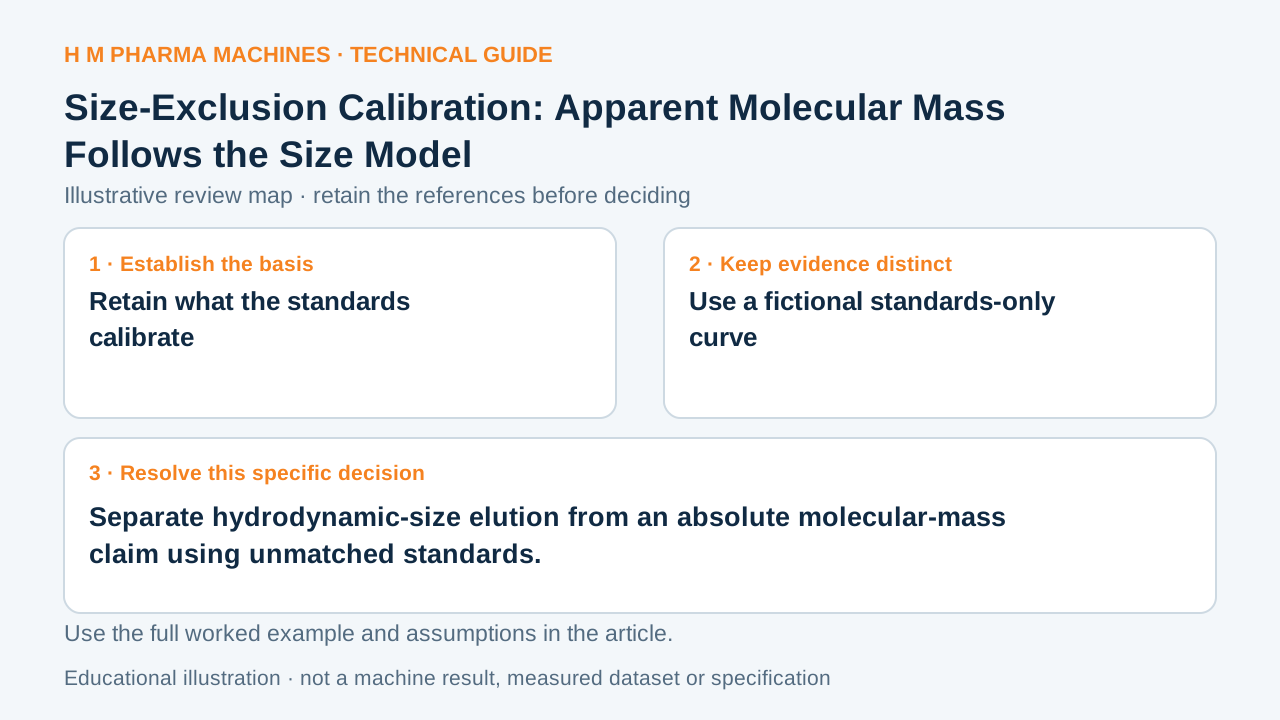
A size-exclusion calibration can report mass relative to its standards without establishing an absolute molecular mass.
Retain what the standards calibrate
Conventional size-exclusion or gel-permeation calibration relates retention time or volume to well-characterized standards. A mass inferred from that relationship is relative to the calibrant. A sample with another relationship between molecular mass and hydrodynamic size need not receive its absolute molecular mass from the same curve. Primary reference: Waters: calibration of the GPC system.
The calibration identity therefore belongs beside the reported result. A number without its standard family and applicable separation conditions can conceal that it represents a standard-equivalent or apparent mass. Size-based separation also requires attention to non-ideal interactions rather than assuming every retention change is molecular mass.
Use a fictional standards-only curve
Define an invented calibration log10(Mapp) = 6 - 0.2 V, where V is in a stipulated volume unit and Mapp in a stipulated mass unit. At V = 10, Mapp is 10000. The curve assigns that value to any modeled observation at that volume; it does not independently establish the true mass of a differently shaped sample.
If independent evidence stated a sample true mass of 15000 at that same modeled volume, the calibration would still return 10000. That discrepancy is intentionally hypothetical. It demonstrates the distinction between the assigned standard-equivalent value and another mass measurement, not a correction factor for SEC.
Name the apparent quantity in the record
Include calibrant identity, its assigned masses, solvent, column conditions, fitted relation, applicable range and sample retention observation. Label the resulting value as relative or apparent where appropriate. Preserve any independent measurement as a separate result with its own method basis.
Before comparing two reports, inspect whether they use compatible standards and assumptions. An apparent decrease cannot automatically establish degradation or a changed absolute mass. This worksheet explains the interpretation of a calibration curve, not a polymer acceptance rule, column recommendation or analytical capability supplied by HM.
Customer Questions
What does V = 10 produce in the toy curve?
The assigned Mapp is 10000.
Is that automatically a true mass?
It is a calibration-assigned apparent value.
Is 15000 a demonstrated sample result?
It is an explicitly hypothetical comparison.
Primary References
These references support the technical principles discussed in this guide. The worked examples and review questions are educational.
Discuss Your Machine Requirement
Share your product, container, required output and the evidence needed for your technical review.
Request a Technical Review