
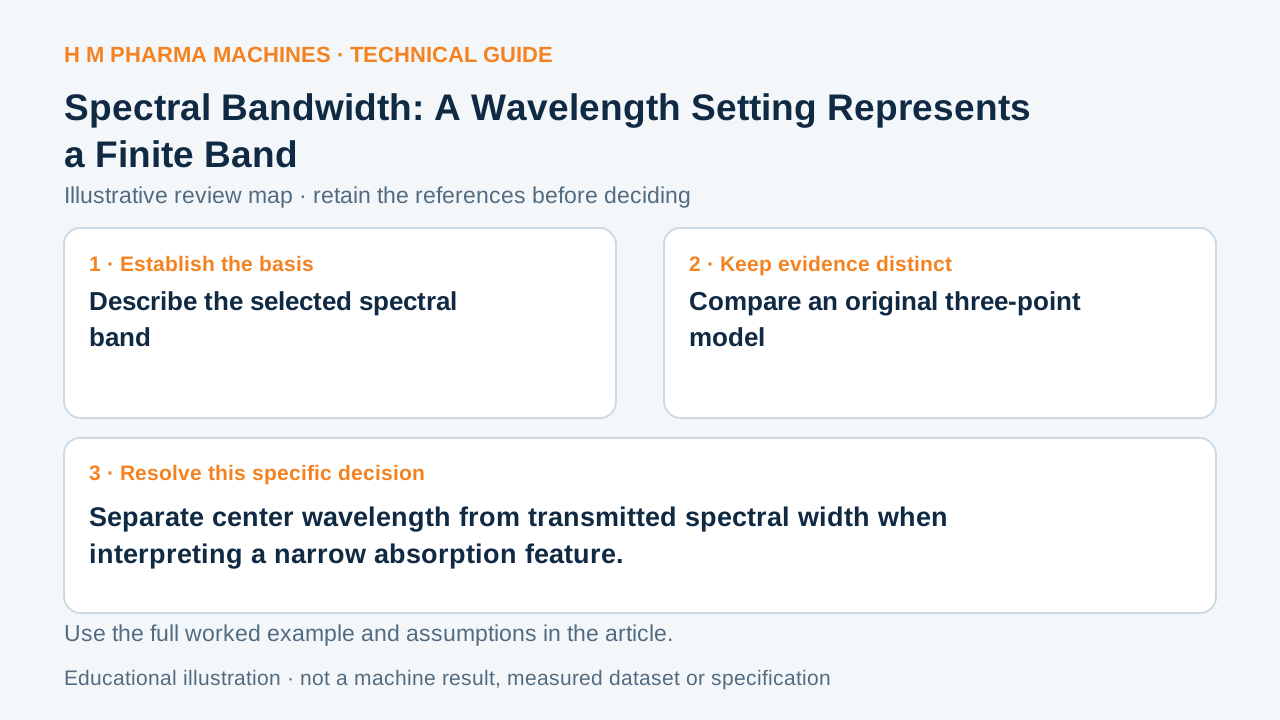
A wavelength setting can describe the center of a finite distribution of light, not one mathematically exact wavelength.
Describe the selected spectral band
A monochromator selects a finite band around a center wavelength. Spectral bandwidth describes the spread of that selected light; it is different from the wavelength value on the axis. Its definition and the instrument profile matter when interpreting a narrow sample feature. Primary reference: Shimadzu: UV-visible spectrophotometer structure.
Two measurements at the same nominal center can have different band distributions. The detector combines contributions from that light rather than measuring only an ideal center ray. Narrowing an exported coordinate interval is also different from narrowing the physical optical band.
Compare an original three-point model
For a deliberately simplified calculation, let three equal-power components represent 598, 600 and 602 nm. Set their fictional sample transmissions to 0.9, 0.1 and 0.9. The combined transmitted fraction is (0.9 + 0.1 + 0.9)/3 = 0.63333, producing A about 0.19837. Center-only transmission 0.1 would produce A = 1.
This is not a model of a real monochromator profile or a conversion between full width at half maximum and three rays. It shows that averaging powers before taking a logarithm differs from reporting the center value, particularly when the sample response changes within the selected band.
Review the physical and exported widths
Make fields for nominal center, bandwidth definition, optical profile information, data-coordinate interval and the sample feature being evaluated. Label any toy component weights as assumptions. Do not write a bandwidth value into the coordinate-spacing column as if they were interchangeable.
When comparing an instrument setting with a sharp spectral feature, seek the applicable optical response and method evidence. A worksheet calculation can flag a sensitivity to averaging, but it cannot choose a universal bandwidth or guarantee resolution. Retaining both quantities makes that missing evidence visible before two spectra are treated as equivalent.
Customer Questions
Is the three-point model a FWHM profile?
No; it is an explicitly equal-weight toy.
Why is its A below the center-only A?
Its combined transmission is higher.
Does finer coordinate spacing narrow the optical band?
Those are separate quantities.
Primary References
These references support the technical principles discussed in this guide. The worked examples and review questions are educational.
Discuss Your Machine Requirement
Share your product, container, required output and the evidence needed for your technical review.
Request a Technical Review