
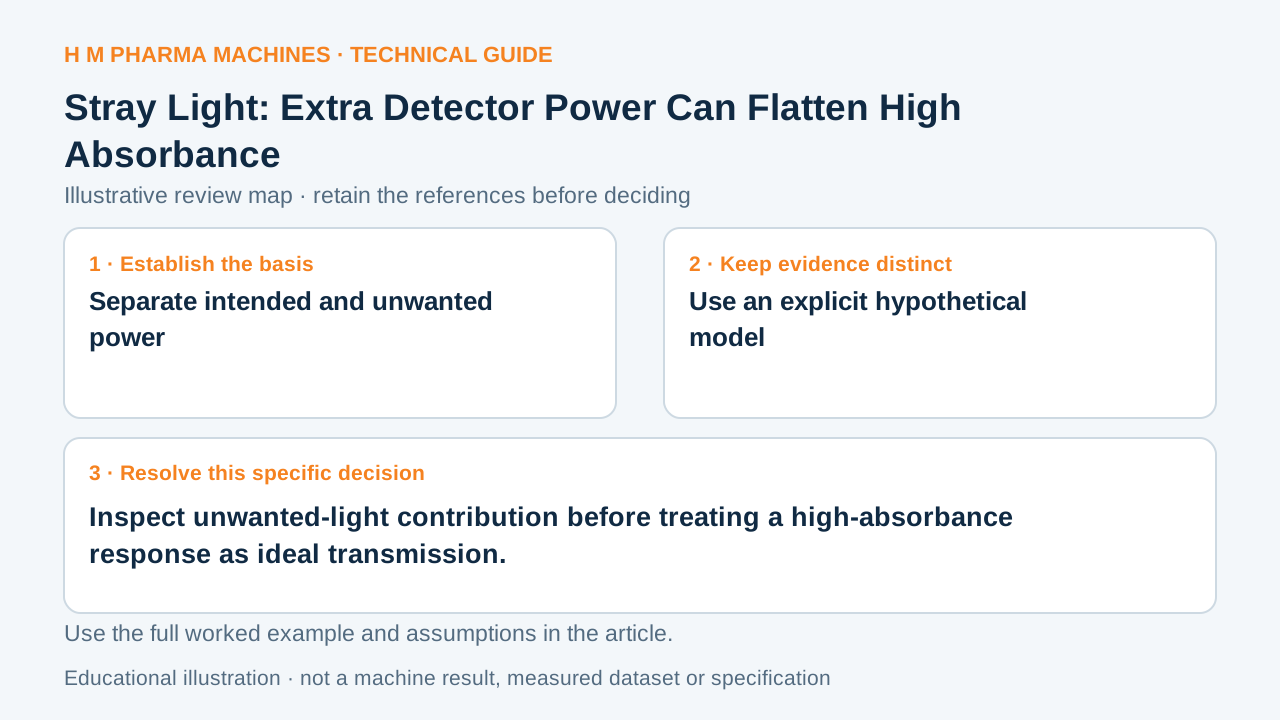
Unwanted detector power can flatten an absorbance response because it enters the transmitted-power measurement.
Separate intended and unwanted power
Stray light is unwanted light reaching the detector outside the intended wavelength selection. It can make transmitted power appear larger and constrain the upper absorbance that can be measured reliably. This effect belongs to the optical measurement rather than to a change in sample concentration. Primary reference: Shimadzu: stray light.
A reading that flattens at high absorbance is not proof of stray light by itself. The amount, spectral distribution and instrument behavior require evidence. A simplified additive-power calculation can nevertheless show the direction of the error without promising a limit for an actual instrument.
Use an explicit hypothetical model
Define reference intended power as 1, true sample transmission T as 0.02 and an equal additive unwanted contribution s as 0.01 in reference and sample observations. The measured ratio is (T + s)/(1 + s) = 0.03/1.01, approximately 0.029703. Ideal A is 1.69897; modeled measured A is about 1.5272.
The extra power makes the sample seem more transmissive, reducing the reported absorbance. At a different true T the error would change. The assumed equal additive contribution is only this worksheet model; it is not a description of every instrument, wavelength or sample.
Distinguish an explanation from an optical test
List intended reference power, true transmission, additive-power assumption, observed ratio and both absorbances. Retain the model equation so an analyst can challenge its physical assumptions rather than only its arithmetic. Do not use the difference as a correction applied to real samples.
For an actual suspected limitation, obtain the instrument-specific stray-light check and its defined wavelength conditions. Compare those observations with the sample method and other possible causes of nonlinearity. The worksheet explains one mechanism; it does not establish a calibration, acceptance test or guaranteed upper reading.
Customer Questions
Why is measured A lower in the example?
The modeled transmitted ratio is larger.
Is s = 0.01 an instrument specification?
It is an invented model input.
Can the calculated error correct a real sample?
Not without a validated applicable model.
Primary References
These references support the technical principles discussed in this guide. The worked examples and review questions are educational.
Discuss Your Machine Requirement
Share your product, container, required output and the evidence needed for your technical review.
Request a Technical Review