
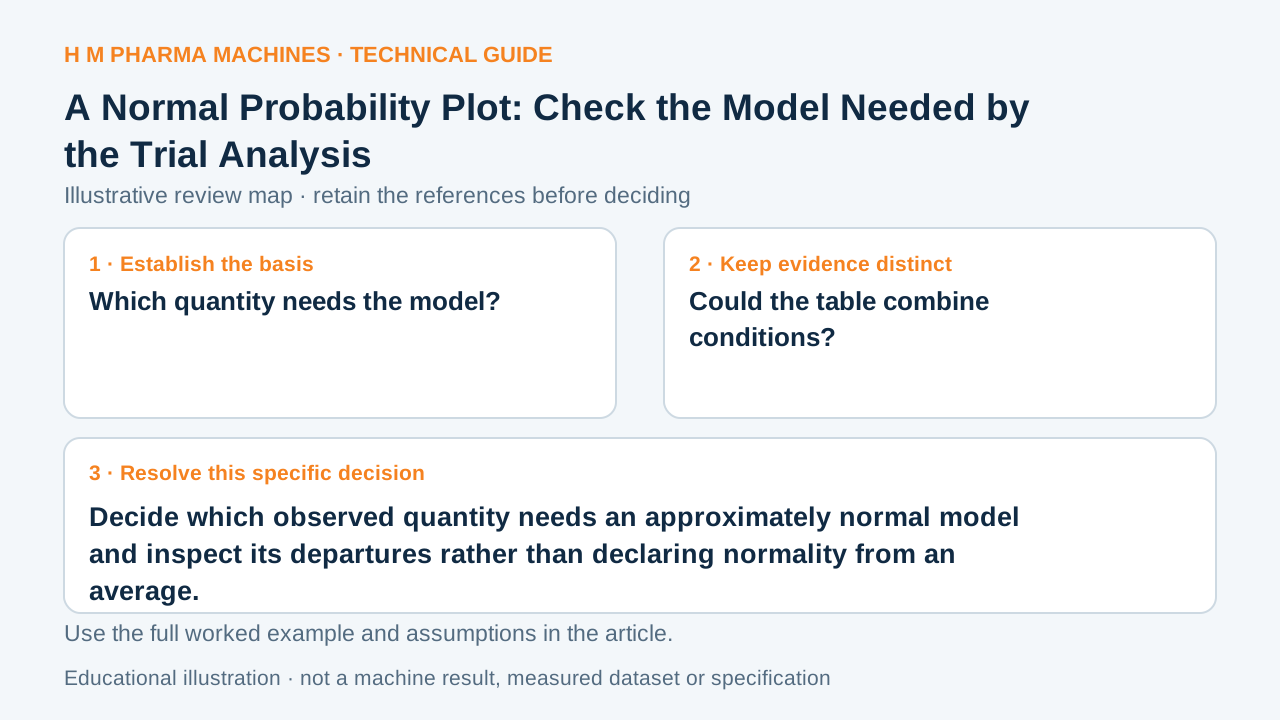
A model assumption should be tied to the quantity being analysed, whether raw outcomes or fitted-model residuals.
State what is being plotted
A normal probability plot compares ordered observations with theoretical normal-distribution positions. An approximately straight pattern supports further consideration of a normal model; systematic departures reveal questions about shape or tails. In a fitted model, the assumption may concern residuals rather than the overall raw response distribution.
A hypothetical mixture is not one distribution
Suppose a trial combines two intentionally different conditions. Plotting all values together may show an apparent departure because the table is a mixture. Identify the actual analysis question before transforming the data to force one attractive straight line.
If the goal is to assess a regression error model, retain the fitted model and plot its residuals instead of substituting a raw-data plot. This distinction changes the object being checked. These examples are educational and do not qualify a real HM process distribution.
Retain shape evidence with the interpretation
Record sample identities, condition groups, sample size and whether the plot uses raw observations or residuals. Keep time and group diagnostics alongside it, because an attractive distribution plot does not establish stable or independent observations.
Ask the analyst to explain departures and the implication for the intended method. A small sample may leave substantial uncertainty about tails; a visual check is not proof of universal behaviour. Avoid treating one normality test outcome as a machinery acceptance decision without the full measurement and process context.
Trial discussion worksheet
This blank worksheet is for your own project. It contains no H M machine trial result.
| Review question | Reference or observation to retain |
|---|---|
| Which quantity needs the model? | Raw response or residual |
| Could the table combine conditions? | Actual group identities |
| What departures are visible? | Shape and tail observations |
Customer Questions
Does an approximately straight plot prove all assumptions?
No. Independence, stability and measurement suitability require separate review.
Should residuals and raw data be interchangeable?
No. They answer different model questions.
Can a small plot establish extreme-tail behaviour?
It provides limited evidence and should be interpreted accordingly.
Primary References
These references support the technical principles discussed in this guide. The worked examples and review questions are educational.
Discuss Your Machine Requirement
Share your product, container, required output and the evidence needed for your technical review.
Request a Technical Review