
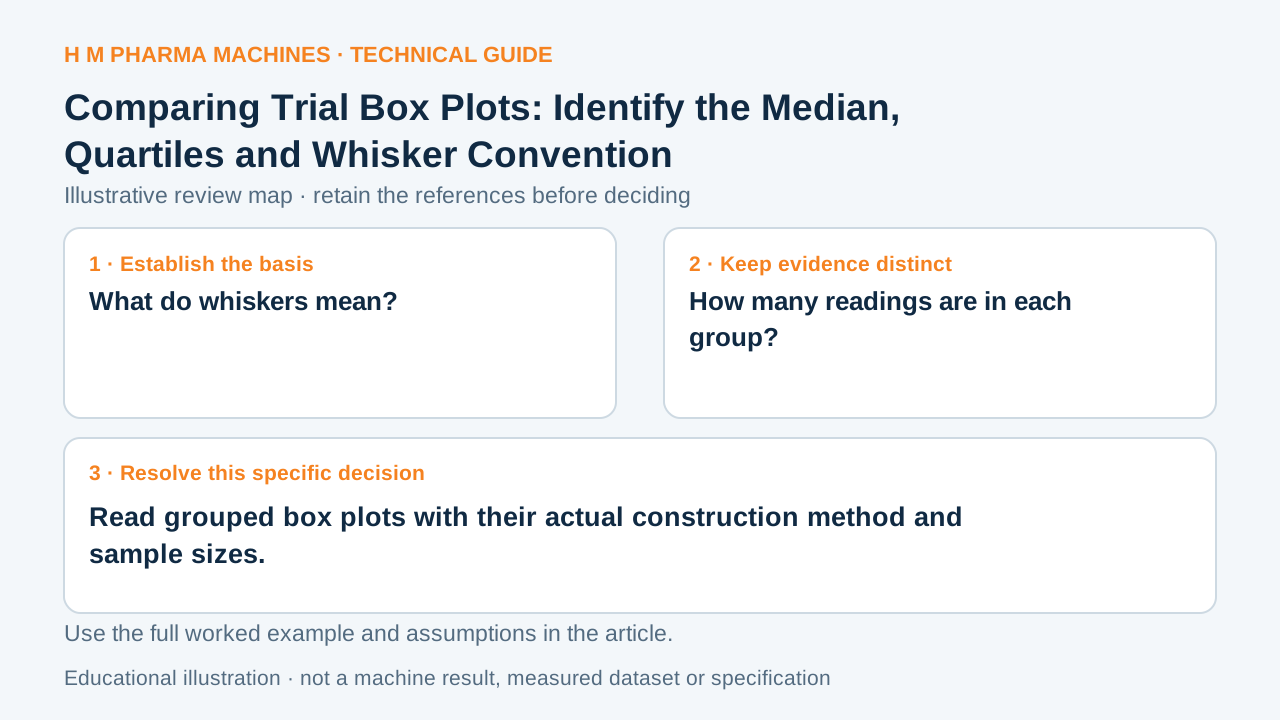
A box plot summarizes a distribution. Its whiskers and marked points need a stated convention.
Know which summary the graphic uses
A usual box plot marks the median and the lower and upper quartiles, with the box describing the middle half of the observations. Whisker and flagged-point conventions vary. A group comparison should identify the chosen construction method rather than assume every software plot displays minimum and maximum at the whiskers.
A hypothetical two-report comparison
One report uses whiskers extending to observed extremes. Another uses a fence-based convention and draws some observations separately. The second report’s shorter whiskers do not alone prove less total spread. First identify how both plots were constructed and inspect all displayed points.
Keep group sample counts visible as well. A small group and a much larger group can show different apparent detail. This example establishes no HM quartile range or acceptance boundary.
Connect each box with its actual condition
Retain group labels, raw observations, units, counts and construction settings. Identify whether the data represent one condition or a mixture. Compare centre and spread separately, and keep time-ordered evidence available when drift may matter.
A point drawn beyond a graphical fence is an investigation prompt, not automatically a rejected product. Product classification requires the approved requirement. Use the box plot to formulate a specific supplier question, such as why two identified conditions have different spread, rather than treating the chart decoration as a machine diagnosis.
Trial discussion worksheet
This blank worksheet is for your own project. It contains no H M machine trial result.
| Review question | Reference or observation to retain |
|---|---|
| What do whiskers mean? | Construction convention |
| How many readings are in each group? | Sample counts |
| Which conditions define groups? | Observed identities |
Customer Questions
Are all whiskers minimum and maximum?
No. Software conventions differ.
Is a marked point automatically nonconforming?
No. A graphical flag and product requirement are separate.
Can a box plot replace time-order analysis?
No. Its distribution summary removes temporal sequence.
Primary References
These references support the technical principles discussed in this guide. The worked examples and review questions are educational.
Discuss Your Machine Requirement
Share your product, container, required output and the evidence needed for your technical review.
Request a Technical Review