
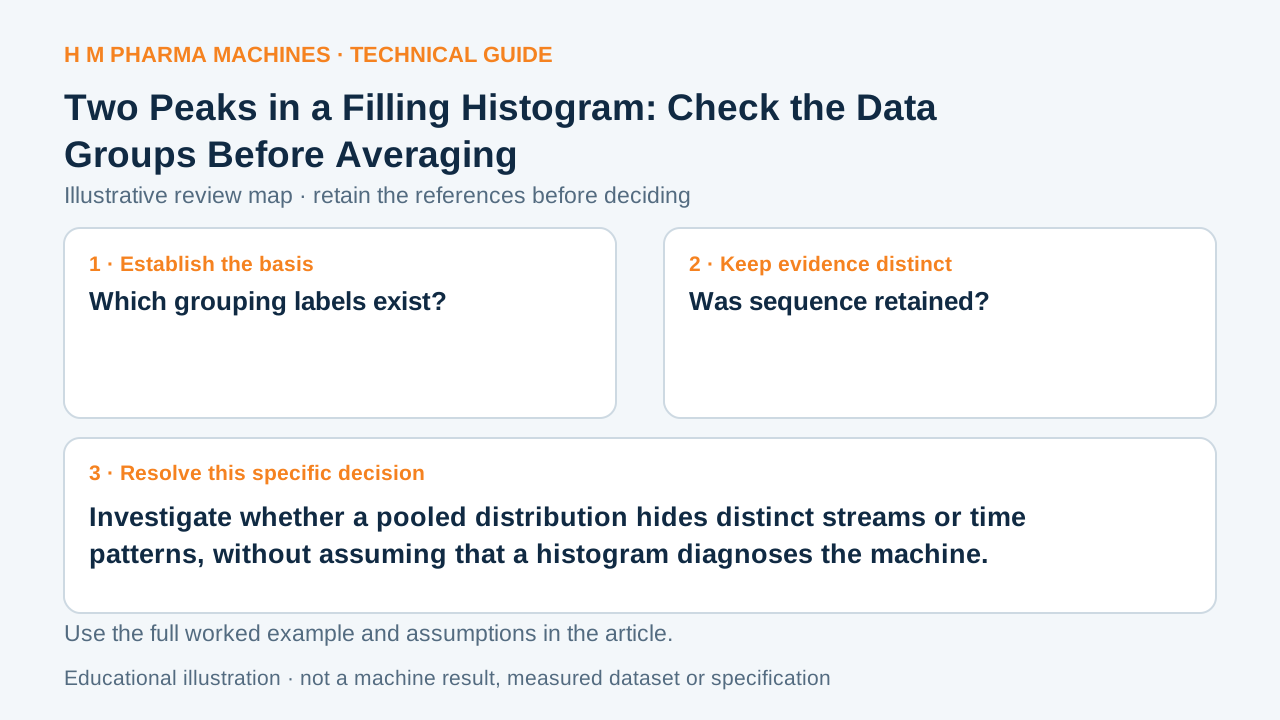
A single average can conceal two clusters. Use a histogram as a prompt to investigate sample groups and sequence.
A distribution view has limits
A bimodal histogram has two peaks. That observation calls for investigation of the underlying data; it does not identify a unique cause. Pooled groups, changing conditions or a cyclic sequence can produce patterns that an overall mean alone conceals. Retain the time order and available grouping labels alongside the histogram.
Separate a hypothetical two-stream record
Suppose a trial contains measurements tagged as filling channel A and B. A pooled plot shows two clusters. Draw the channel-specific plots using the same axes, then examine the time-ordered readings within each channel. If the separation persists, the next enquiry concerns the two identified streams; if it disappears, investigate the grouping and plot construction.
Do not relabel clusters as channels when channel identity was never recorded. That would turn a visual guess into invented evidence. Also inspect the chosen bin boundaries and sample count before treating a small visual bump as a separate population. The example demonstrates a review approach, not an HM fault diagnosis.
Prepare evidence that can answer the follow-up
Preserve raw values, units, sequence, sample ID and only those channel or condition labels genuinely observed. Send the pooled and grouped plots together so the supplier can understand what changed. Describe the observation as two visible clusters under the stated plotting choices.
Avoid adjusting machine settings solely to make a histogram look symmetric. First determine whether grouping, measurement or process conditions explain the shape. If the groups represent different products or configurations, an overall capability number may answer no useful single-process question. Choose the eventual analysis with the trial owner.
Trial discussion worksheet
This blank worksheet is for your own project. It contains no H M machine trial result.
| Review question | Reference or observation to retain |
|---|---|
| Which grouping labels exist? | Observed head, lot or condition IDs |
| Was sequence retained? | Original ordered readings |
| Can plot choices change the apparent peaks? | Same axes and documented bins |
Customer Questions
Do two peaks prove a two-head fault?
No. Several data structures can produce two peaks.
May I assign head IDs from the clusters?
No. Use recorded identities rather than inferred labels.
Why retain the time sequence?
It can reveal changes or cycles hidden by a distribution summary.
Primary References
These references support the technical principles discussed in this guide. The worked examples and review questions are educational.
Discuss Your Machine Requirement
Share your product, container, required output and the evidence needed for your technical review.
Request a Technical Review