
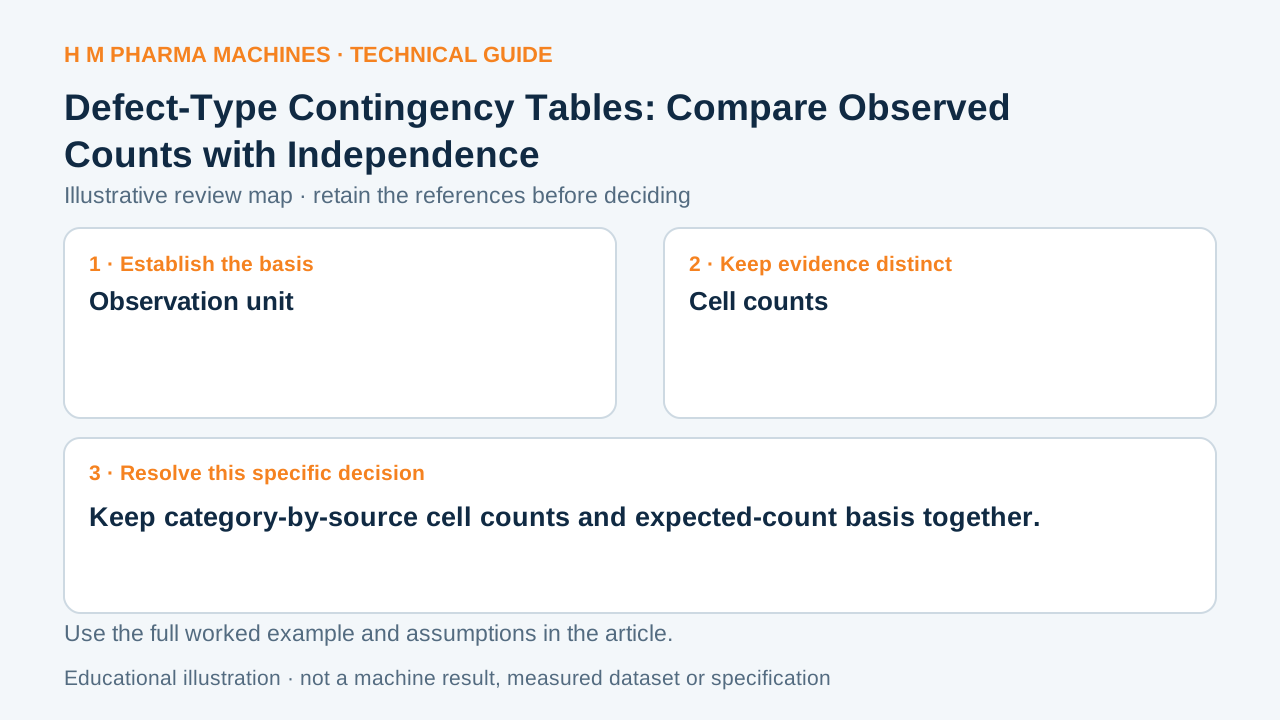
A defect-type-by-source table asks whether classifications are associated. Preserve cell counts and expected counts instead of comparing percentages without their totals.
The statistical question
A contingency analysis compares observed cross-classified counts with counts expected if the classifications are independent. An expected cell count is its row total times its column total divided by the grand total. The usual chi-square approximation needs an appropriate count structure and adequate expected frequencies. Association does not by itself prove that a shift, supplier or machine caused the findings.
An illustrative review example
For an invented two-by-two table, source A has 10 seam findings and 20 print findings; source B has 30 seam findings and 40 print findings. Row totals are 30 and 70, column totals 40 and 60, and the grand total 100. The independence expectation for A-seam is 30 times 40 divided by 100, or 12. This calculation concerns the classified findings, not the overall defect rate among all produced packs.
Prepare the evidence for discussion
Retain the category definitions, observation unit, row and column totals, selection window and treatment of items with multiple findings. Tell the analyst if categories overlap or counts are correlated within packs. Put production exposure denominators in a separate record when the question instead concerns rates. For a labeling problem, ask what additional material, timing or setup evidence is needed before proposing a causal explanation.
Observed classifications and independence
This blank worksheet is for your own project. It contains no H M machine trial result.
| Question to resolve | Evidence to retain |
|---|---|
| Observation unit | Item or finding definition |
| Cell counts | Cross-classified observations |
| Expected counts | Row times column over total |
| Interpretation | Association and population boundary |
Customer Questions
Where does an expected cell count come from?
Under independence, multiply its row total by its column total and divide by the grand total.
Is this automatically a production defect-rate analysis?
No. The population and count unit determine what the classified table represents.
Does category association establish a machine cause?
An association needs additional evidence before a causal explanation can be justified.
Primary References
These references support the technical principles discussed in this guide. The worked examples and review questions are educational.
Discuss Your Machine Requirement
Share your product, container, required output and the evidence needed for your technical review.
Request a Technical Review