
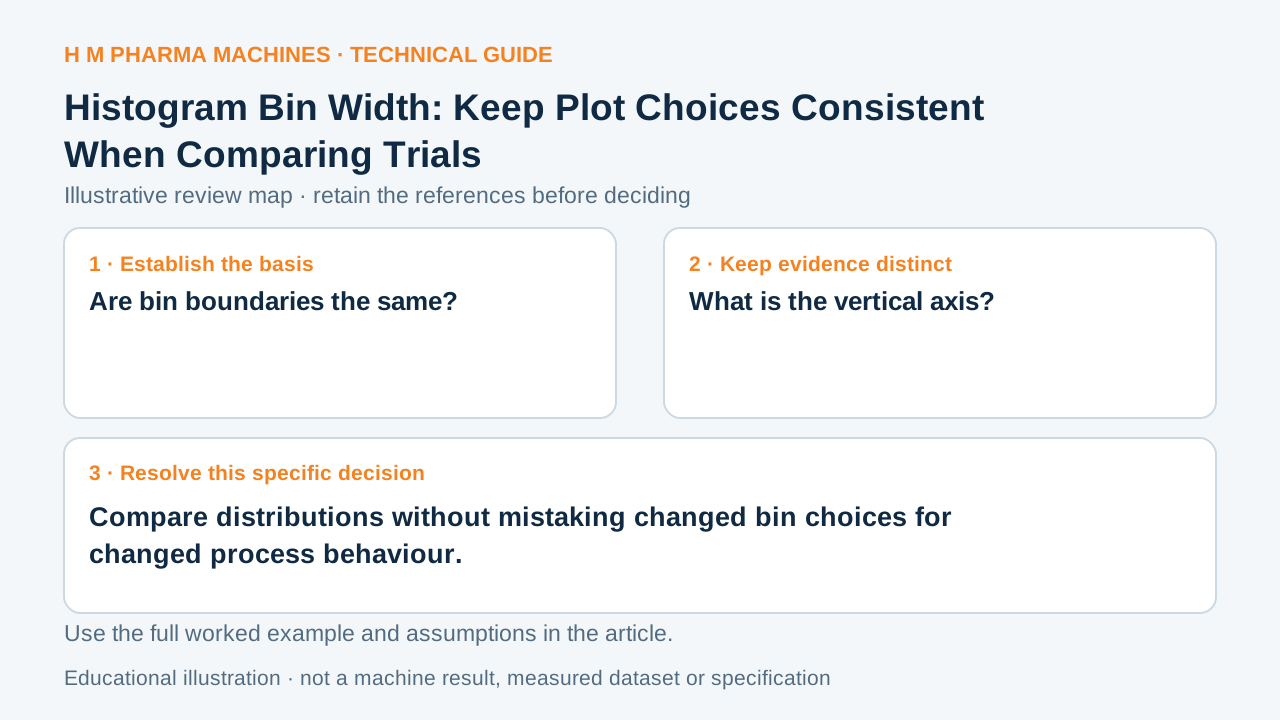
The same readings can look smoother or more fragmented when histogram bins change.
A histogram is a grouped display
A histogram counts observations within defined value intervals. Bin width and boundaries affect the appearance of the distribution. Document those choices when comparing trial plots. A change in bar pattern is not necessarily a change in the underlying observations, and a histogram does not retain their time order.
A hypothetical presentation mismatch
Two suppliers provide plots of the same illustrative readings. One uses broad intervals; the other uses narrow intervals. The first looks compact and smooth, while the second shows several separated bars. Before interpreting one process as more uniform, reconstruct both plots using the same units, range and bin boundaries.
Also retain sample counts and whether the vertical axis reports raw counts or a normalized quantity. A taller bar can reflect more observations rather than a larger proportion. This scenario describes plot comparability, not an HM performance comparison.
Send the data as well as the picture
Ask for raw values, sample identities, units, bin boundaries, axis definition and sample scope. Use a consistent plotting convention for the comparison, and inspect whether conclusions are sensitive to reasonable alternative bins.
Do not choose boundaries solely to hide a gap or make a distribution appear unimodal. If the sample is small, avoid treating every bar irregularity as a process feature. Keep time and group views available so the histogram supports the enquiry without replacing the context that produced the readings.
Trial discussion worksheet
This blank worksheet is for your own project. It contains no H M machine trial result.
| Review question | Reference or observation to retain |
|---|---|
| Are bin boundaries the same? | Declared width and origin |
| What is the vertical axis? | Counts, proportions or density |
| Do scopes and quantities match? | Sample counts and conditions |
Customer Questions
Can bin choices change the apparent shape?
Yes. Keep their definitions visible.
Does a higher count bar always mean a higher fraction?
No. Compare sample size and normalization.
Does a histogram show the run sequence?
No. Preserve a separate ordered view.
Primary References
These references support the technical principles discussed in this guide. The worked examples and review questions are educational.
Discuss Your Machine Requirement
Share your product, container, required output and the evidence needed for your technical review.
Request a Technical Review