
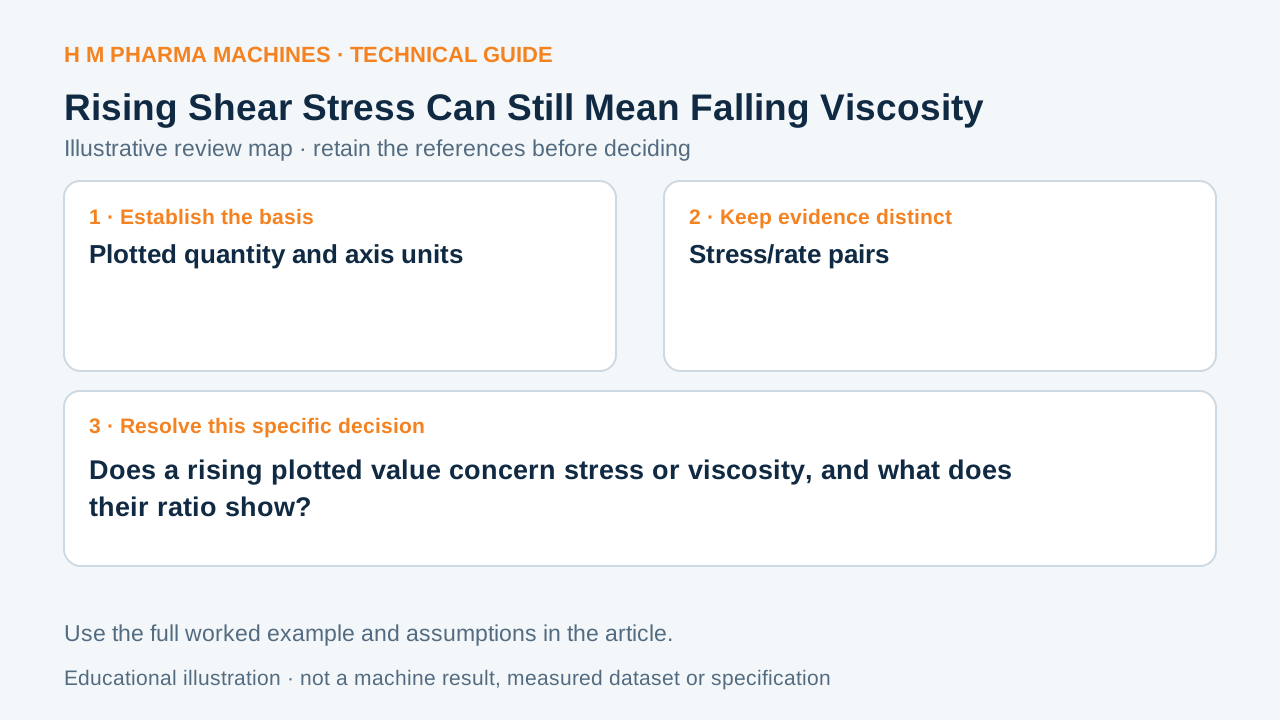
A stress curve and a viscosity curve can rise or fall differently. Read the quantity on each axis before classifying the material.
Read the Reported Quantity
Apparent viscosity is the ratio of shear stress to shear rate. Anton Paar’s viscometry reference presents that relationship. A higher shear stress at a higher rate does not by itself prove higher viscosity, because the denominator has changed as well.
Retain the stress unit Pa and the rate unit s⁻¹. A stress-versus-rate plot is a flow curve; a viscosity-versus-rate plot presents the corresponding ratio. Their labels answer different questions even when they come from the same observations. Primary rheology reference.
Illustrative Ratio Calculation
Invented observations are 10 Pa at 10 s⁻¹ and 30 Pa at 100 s⁻¹. The corresponding apparent viscosities are 1 Pa·s and 0.3 Pa·s. Stress has increased, while the ratio has decreased. These are hypothetical arithmetic values, not syrup test data.
Calling this two-point illustration shear thickening simply because stress rises would confuse the axes. Two points also do not characterize every region of a real formulation. The responsible laboratory should identify the complete measured range and any method limitations.
Carry Both Plots into the Discussion
Where a supplier receives only a cropped graph, restore the legend, axes, units and condition references. Ask whether the displayed values are raw stress, apparent viscosity or a fitted model. Keep calculated ratios recognizable as calculations instead of new measurements.
Use the worksheet to reconcile a material description with the supplied data. For a liquid-filling enquiry, this prevents a graph-label error from becoming an equipment selection claim. It does not supply a universal shear-rate target or authorize changes to the product formulation. HM application context: Syrup Liquid Filling Machine.
Rising Shear Stress Can Still Mean Falling Viscosity — blank interpretation record
This blank worksheet is for your own project. It contains no H M machine trial result.
| Comparison | Evidence/reference | Reviewer |
|---|---|---|
| Plotted quantity and axis units | To complete | To complete |
| Stress/rate pairs | To complete | To complete |
| Calculated apparent viscosities | To complete | To complete |
| Measured range and model identity | To complete | To complete |
Customer Questions
Does rising stress prove shear thickening?
No. Evaluate viscosity relative to rate, with the actual measured range.
What unit does Pa divided by s⁻¹ give?
Pa·s, a dynamic viscosity unit.
Are two points a full rheological characterization?
No. Their scope and the unmeasured regions remain explicit.
Related Equipment References
Review the actual offered equipment and application separately from this educational example.
Primary References
These references support the technical principles discussed in this guide. The worked examples and review questions are educational.
Discuss Your Machine Requirement
Share your product, container, required output and the evidence needed for your technical review.
Request a Technical Review