
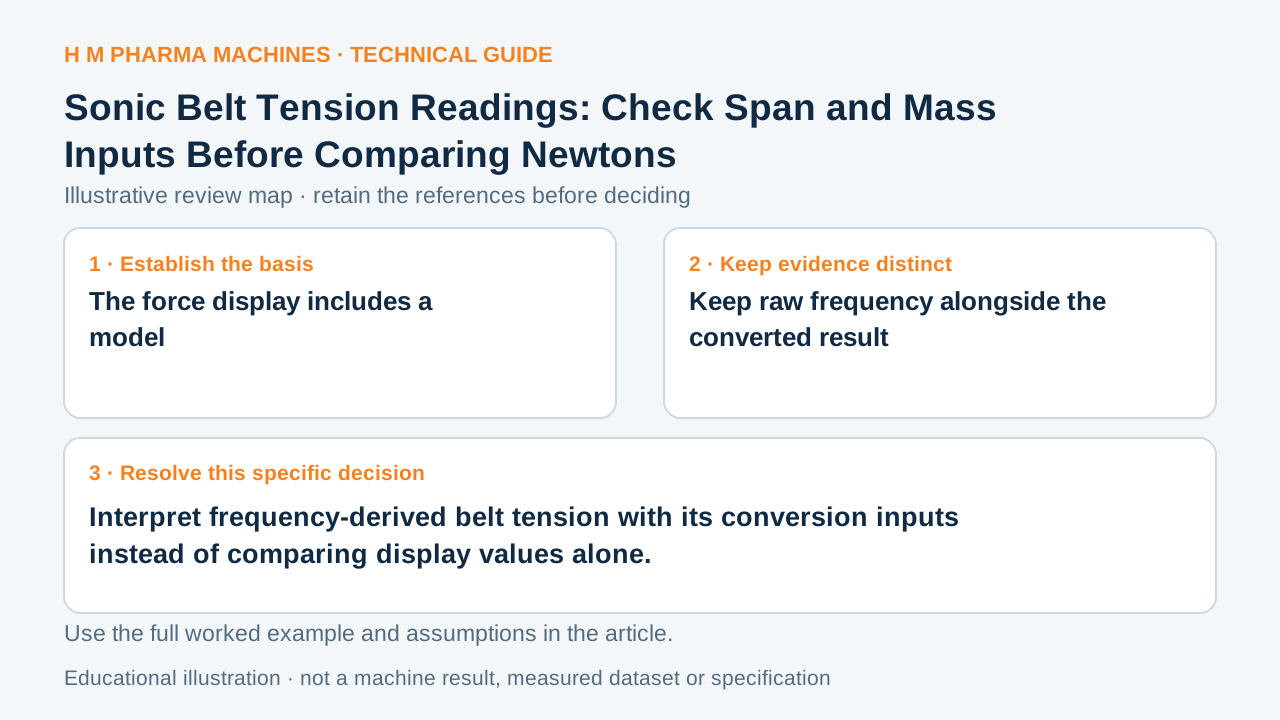
Interpret frequency-derived belt tension with its conversion inputs instead of comparing display values alone.
The force display includes a model
A sonic tension meter measures a span's vibration frequency and converts it using entered belt and span information. Gates' manual identifies mass, width and span length as required inputs. Under the described model, squared frequency and squared span length influence the converted tension. A number displayed in newtons is consequently more than a direct frequency reading. Two reports cannot be compared confidently if they used different or undocumented conversion inputs.
Gates: 550C sonic tension meter manual supports the technical principle above.
Keep raw frequency alongside the converted result
Use a measurement sheet with the identified drive, exact belt designation, span definition, measured span length, entered mass constant, width, units and raw frequency. Add the instrument identity and the applicable method reference. Do not carry forward a stored instrument profile merely because it is named line one; confirm that its parameters still describe the present belt and span.
Record whether the result is a measured condition or an acceptance decision against a designer-specified range. A consistent display does not establish that the range itself is correct. Keep conversion evidence and the drive's permitted tension basis separate so a change in belt or geometry cannot hide behind the same profile name.
Hypothetical input-sensitivity worksheet
Consider a fictional comparison holding belt mass, width and measured frequency unchanged. One report enters a span of 400 mm and another enters 500 mm. The model's span-squared ratio is (500/400)² = 1.5625. The second converted tension would therefore be 56.25% higher solely because of that input difference, under the same model. Next, hold all inputs constant but compare frequencies of 80 and 100 Hz: the frequency-squared ratio is also 1.5625. These two teaching calculations show why the raw frequency and conversion inputs must accompany the result. They are not HM tension measurements or target settings.
Resolve interpretation before changing the drive
When two reports disagree, first reconcile the drive identity, span and input values. Then evaluate measurement conditions and the applicable instrument limitations. Only the responsible drive instruction can define how the accepted tension is established. This article does not direct a powered-machine measurement or an adjustment. For a machinery handover, request enough measurement context to interpret a future tension report. The useful output is a reproducible evidence record, rather than a borrowed frequency or newton value that belongs to a different belt assembly.
Customer Questions
Can I compare two newton displays without the input settings?
Not reliably. Frequency conversion depends on the identified belt and span inputs.
Is a stored meter profile proof that the values are current?
No. Confirm it still describes the present drive and belt.
Does this calculation provide a recommended tension?
No. It demonstrates input sensitivity; the drive-specific instruction supplies the acceptable basis.
Related Equipment References
Review the actual offered equipment and application separately from this educational example.
Primary References
These references support the technical principles discussed in this guide. The worked examples and review questions are educational.
Discuss Your Machine Requirement
Share your product, container, required output and the evidence needed for your technical review.
Request a Technical Review